


Average digital designer produces equivalent of one-way flight in emissions a year, report shows
A new report outlines the environmental impact of unsustainable digital design practices, plus actions to take to counter them.
Share
Sustainable Digital Design initiative and Wonderland Studio have produced a report looking into the effect digital design is having on global carbon emissions. By focusing on an often overlooked area issue when it comes to sustainability, the report emphasises the increasing importance of making our daily digital practices sustainable.
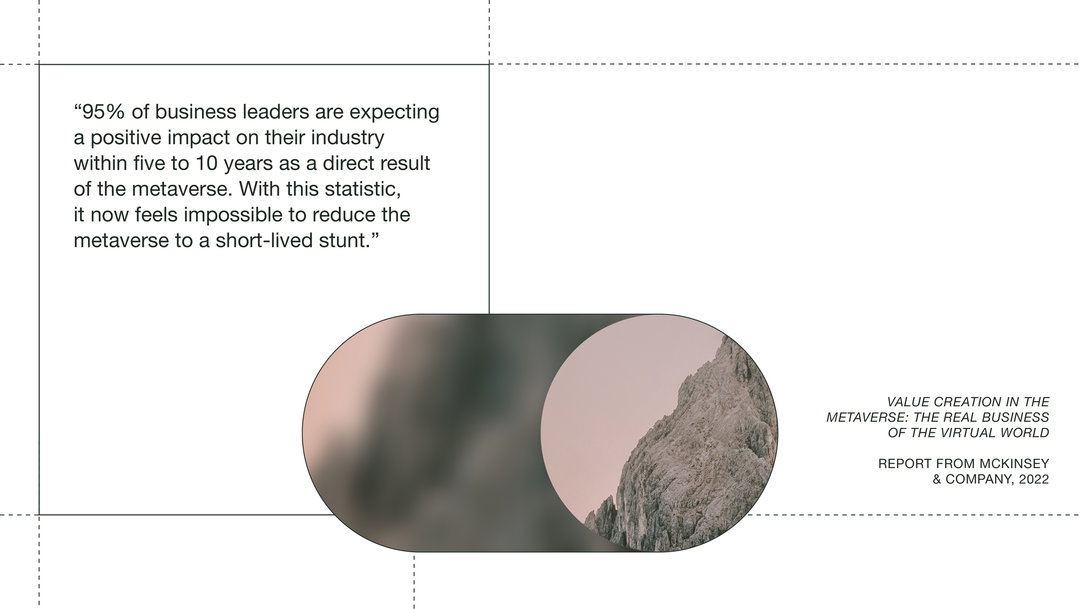
“The carbon footprint of our gadgets, the internet, and the systems supporting them account for about 3.7 per cent of global greenhouse emissions, according to some estimates,” the report states, quoting a 2020 BBC article. “It is similar to the amount produced by the airline industry globally, explains Mike Hazas, a researcher at Lancaster University. And these emissions are predicted to double by 2025.” As the report outlines, digitalisation is inextricable from design; with industries rushing to set standards of the Metaverse and real-time collaboration already made possible by tools from Google Docs and Notion to Miro and Figma. Ultimately, digital design tools increase CO2 emissions “at a time when we should be looking to neutralise our [them]”, the report says.
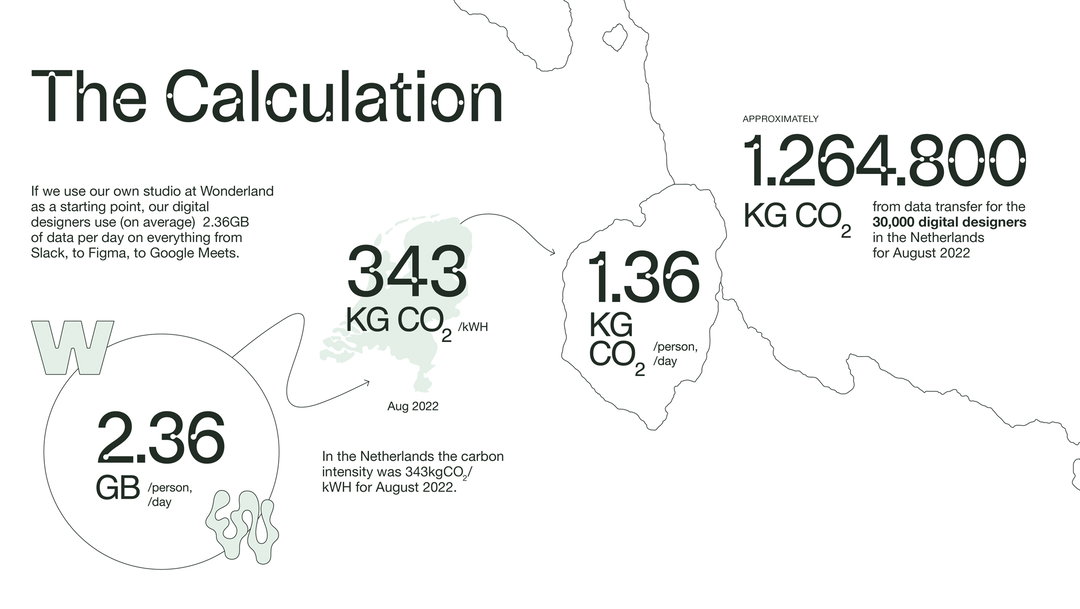
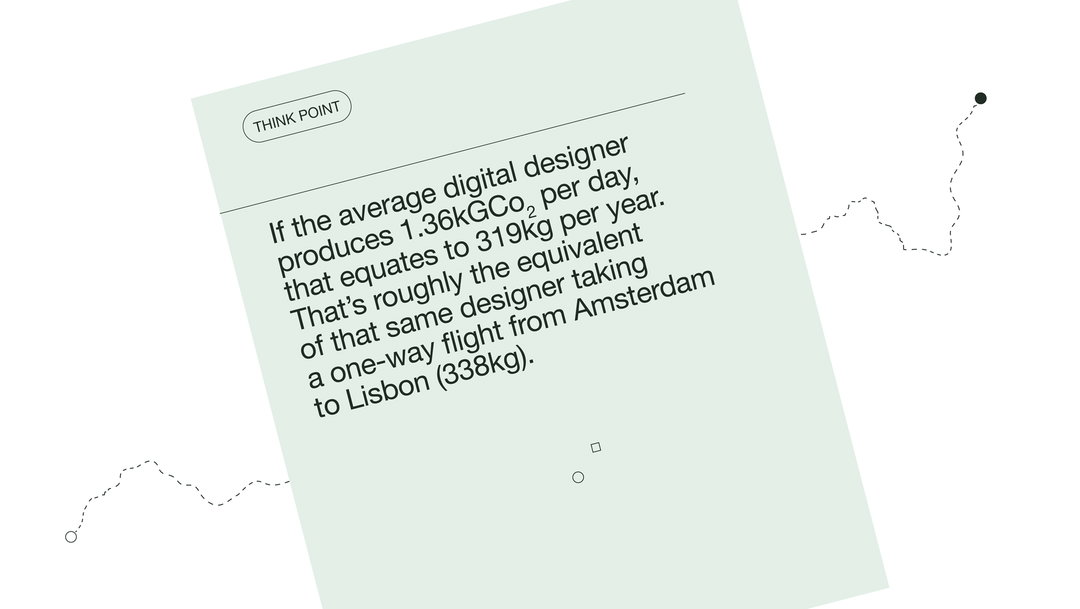
Using the data from the Wonderland Studio team as a starting point, the report calculates that the average digital designer produces 1.36kg CO2 per day, and 319kg per year. “That’s roughly the equivalent of that same designer taking a one-way flight from Amsterdam to Lisbon (338kg).”
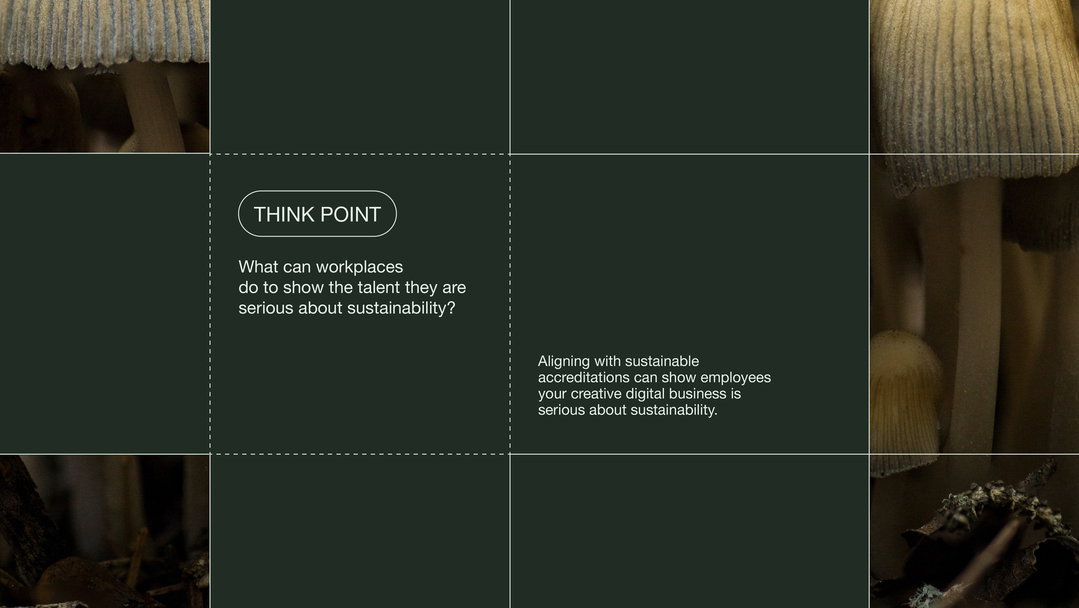
Wonderland Studio: The State of Sustainable Digital Design Report (Copyright © Sustainable Digital Design / Wonderland Studio, 2022)
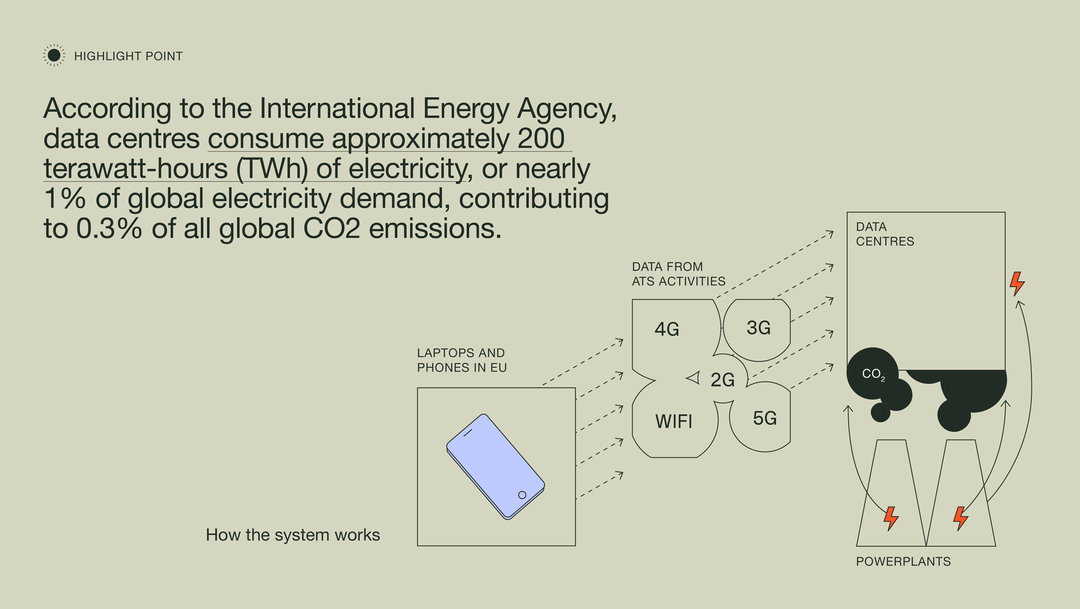
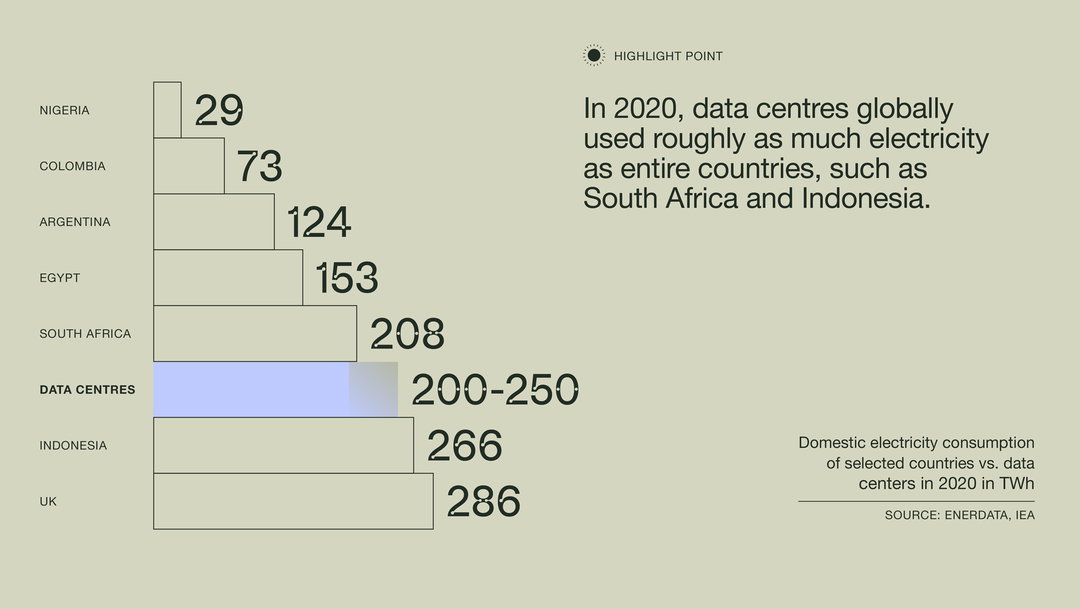
So why does digital emit CO2 in the first place? “The biggest emitter is data centres”, the report states – a physical facility that organisations use to house their critical applications and data.” In 2020, data centres globally used roughly as much electricity as entire countries, such as South Africa and Indonesia. The JRC Code of Conduct is a collection of best practices for data centres to be energy efficient, and therefore have a smaller impact on the environment; as of 2022, 450 data centres have joined.
One element of creative work that can have “a real impact on digital emissions”, is sending large working files, or WIPs, to clients. According to the report, compressing these or rendering at lower resolutions during the concepting phase has the potential to save 54.6kg CO2 per person, per year.
The report also points organisations towards initiatives and trends emerging within the sustainable digital design space. From organisations challenging unsustainable clients, like Clean Creatives to a handbook helping to motivate young creatives to act against high carbon clients (called the Brief Sabotage Handbook). It also highlights education points like news platforms We Are Europe and Lowtech Magazine – a website about sustainable technology that is powered entirely by solar power. To find more insights and tools for sustainable design, readers can access the full report here.
GalleryWonderland Studio: The State of Sustainable Digital Design Report (Copyright © Sustainable Digital Design / Wonderland Studio, 2022)

Hero Header
Wonderland Studio: The State of Sustainable Digital Design Report (Copyright © Sustainable Digital Design / Wonderland Studio, 2022)
Share Article
About the Author
—
Liz (she/they) is the senior editor at Insights, a research-driven department within It’s Nice That. They previously ran the news section of the website. Get in contact with them for potential Insights collaborations or to discuss Insights’ public-facing reports.