


Which country is home to 39 chickens for every person? A new book of infographics answers this question and many more
The Slow Journalism company gears up to release An Answer For Everything this week featuring 200 questions we’ve all asked, paired with striking and informative infographics.
Share
“We live in a time when objectivity is at risk,” says Rob Orchard, director of The Slow Journalism Company and co-author of the new infographics-filled book An Answer For Everything. “The idea of people having their own ‘truths’ and of ‘alternative facts’ is immensely dangerous, particularly when combined with the polarisation of societies and the immediacy of social media.” As a result, we can end up overwhelmed with opinions, but with precious few concrete facts to hold on to, Orchard claims.
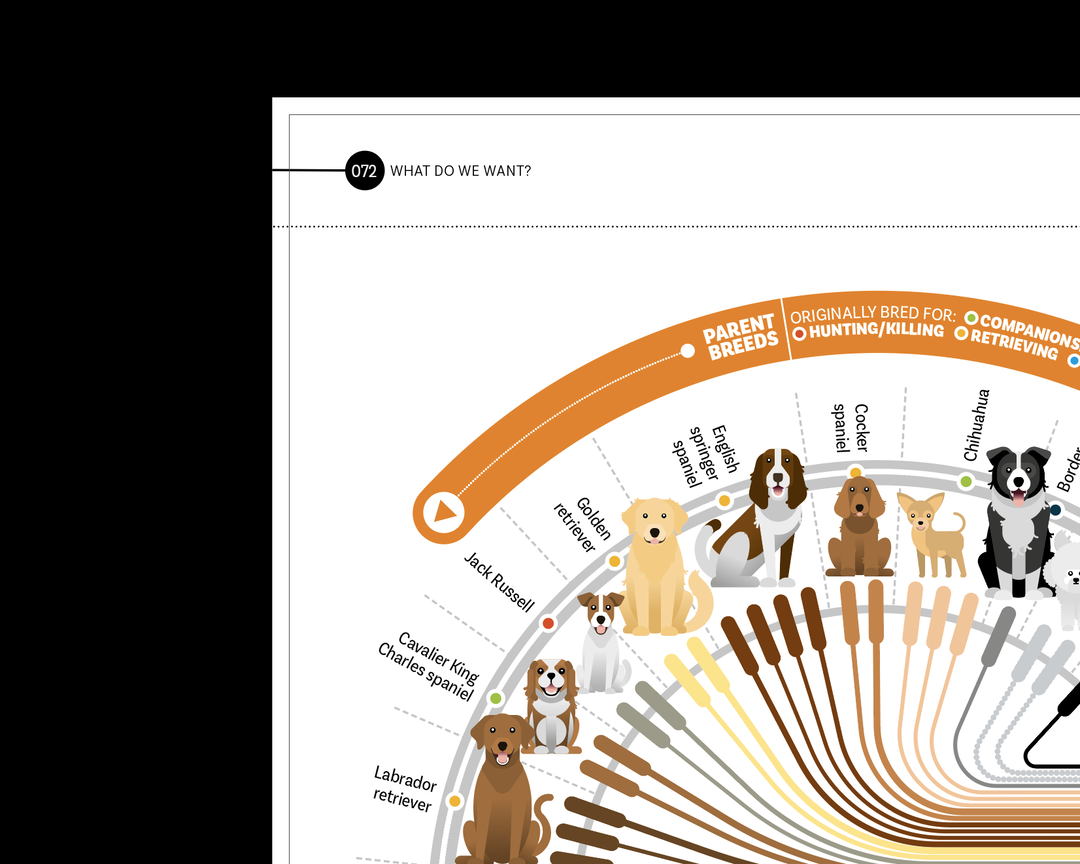
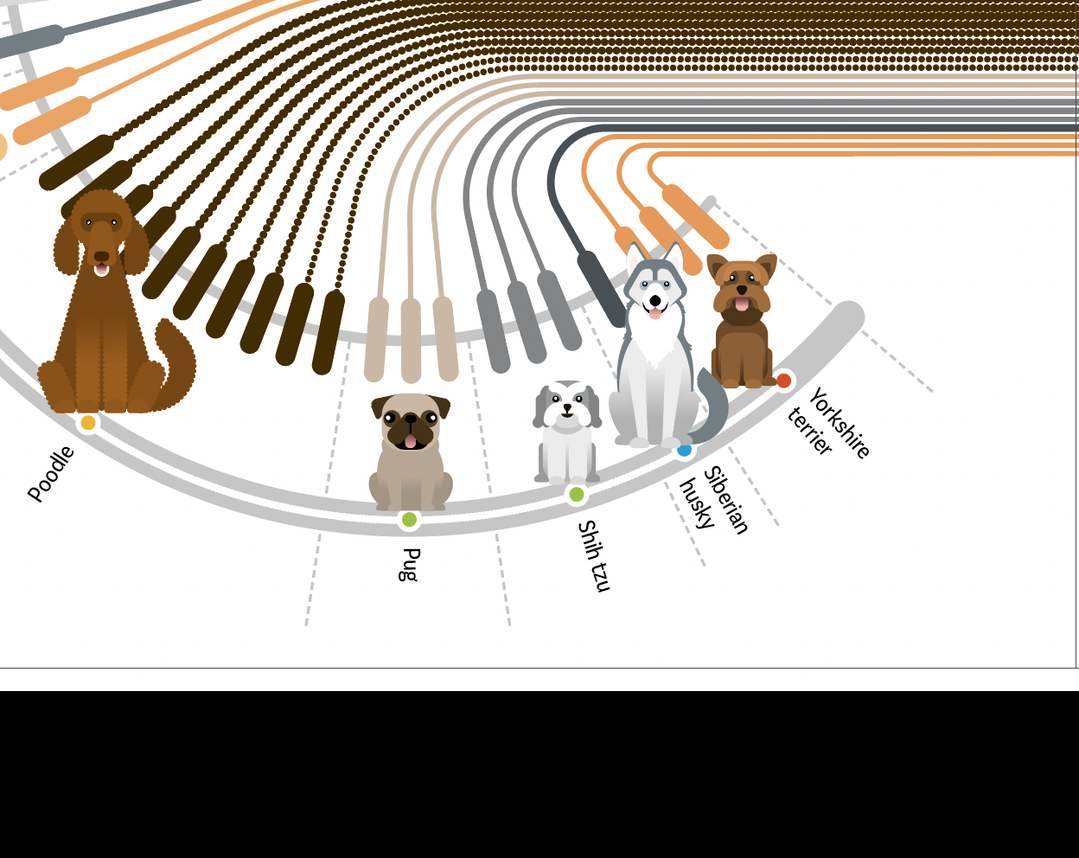
This is what motivated Orchard, along with Christian Tate and Marcus Webb – the team behind the magazine Delayed Gratification – to create the new book, which they say presents facts in an “objective but engaging form”. From low-stakes questions like, “Which are better, cats or dogs?” to questions on climate change, war, violence and disease, “where the stakes couldn’t be higher,” Orchard says, the book gives us a deep look into the questions we’re all asking ourselves and each other every day.
Creatively, there were lots of challenges involved in the project. “For the first time ever we were working completely remotely thanks to the pandemic, so we had to set up new workflows, new technology and new ways to brainstorm and check ideas,” says Orchard. Also, 320 pages of infographics, alongside putting out four issues of their magazine – the work “nearly broke” them, he says. They’d also never made a book before, only magazines, so they realised that there are creative differences between the two that they’d not thought about. “You still need an ebb and flow of silly and serious stories, but you have way more space to play with,” says Orchard. “Infographics that we’d have crammed into two pages in the magazine ended up getting turned into all-singing, all-dancing eight-page creations for the book!”
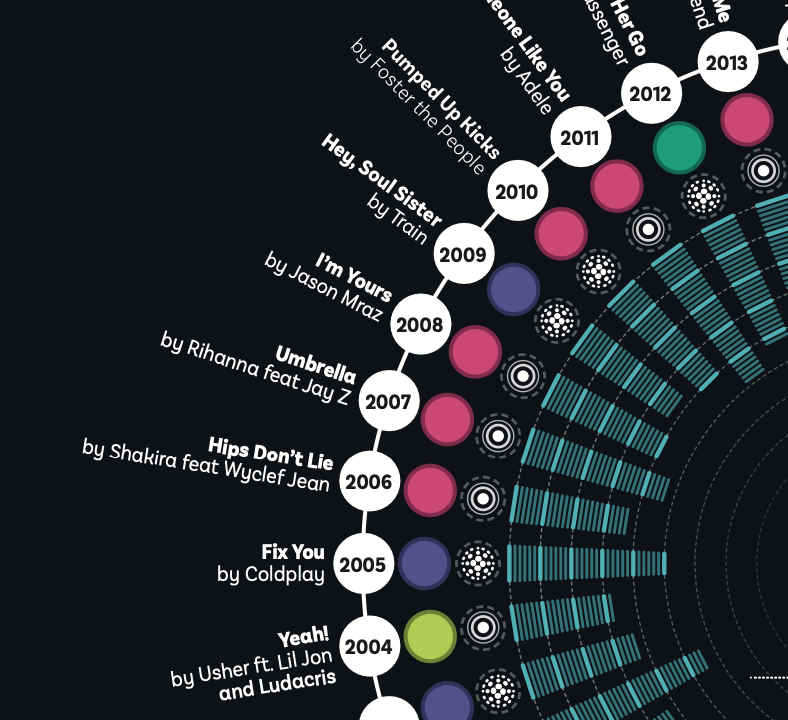
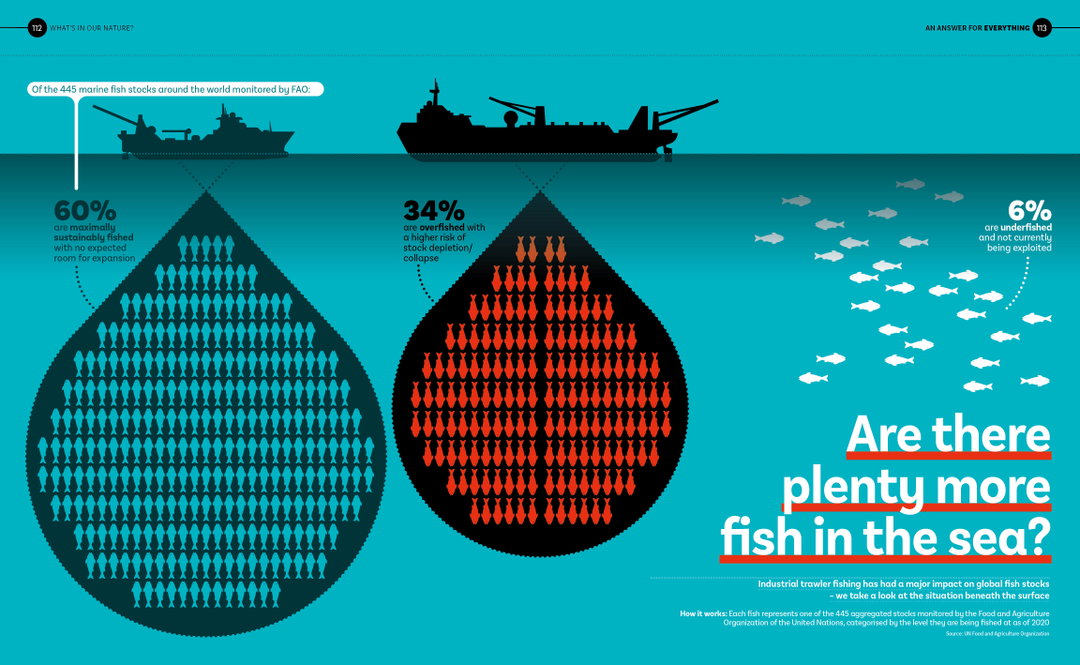
When gathering inspiration for the project, the team looked between themselves, referring back to their own desires to see if data could answer a question that each of them had been pondering for years. Questions like: What exactly is the best novel of all time? Or who’s the greatest sportsman? And what do most people die of in soap operas? “Sometimes we let the questions lead the way – working out definitively what is the best thing since sliced bread, if there are plenty more fish in the sea and what love has to do with it were interesting creative challenges.” They also jumped into “interesting-sounding data sets to see what stories emerged”. For example, they turned to the UN to find out the country which is home to 39 chickens for every person. (“It’s Brunei.”)
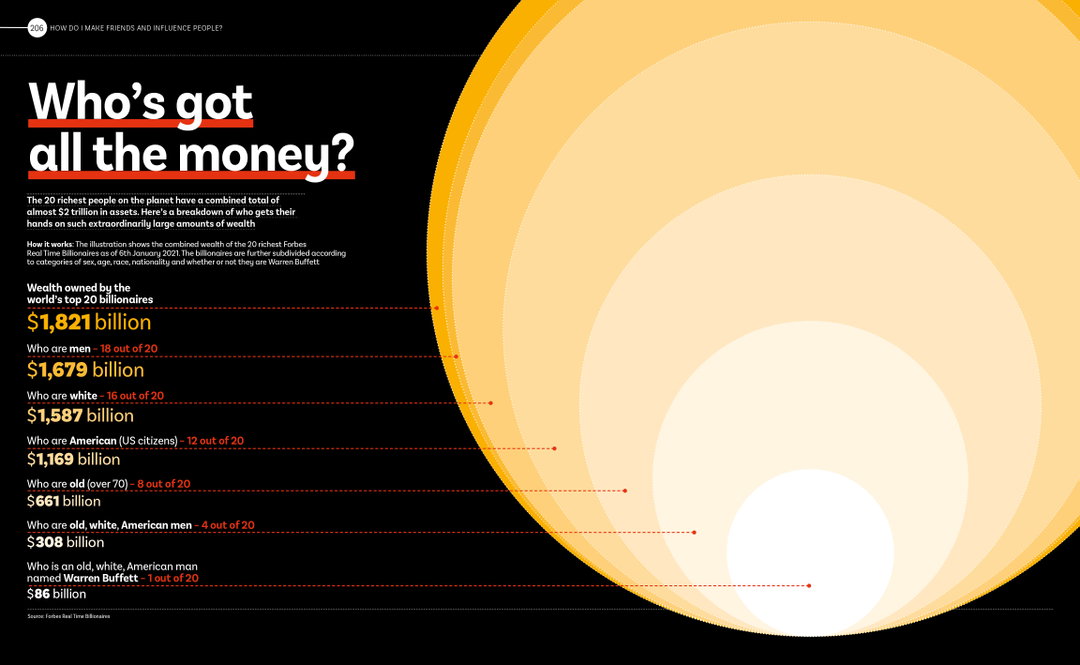
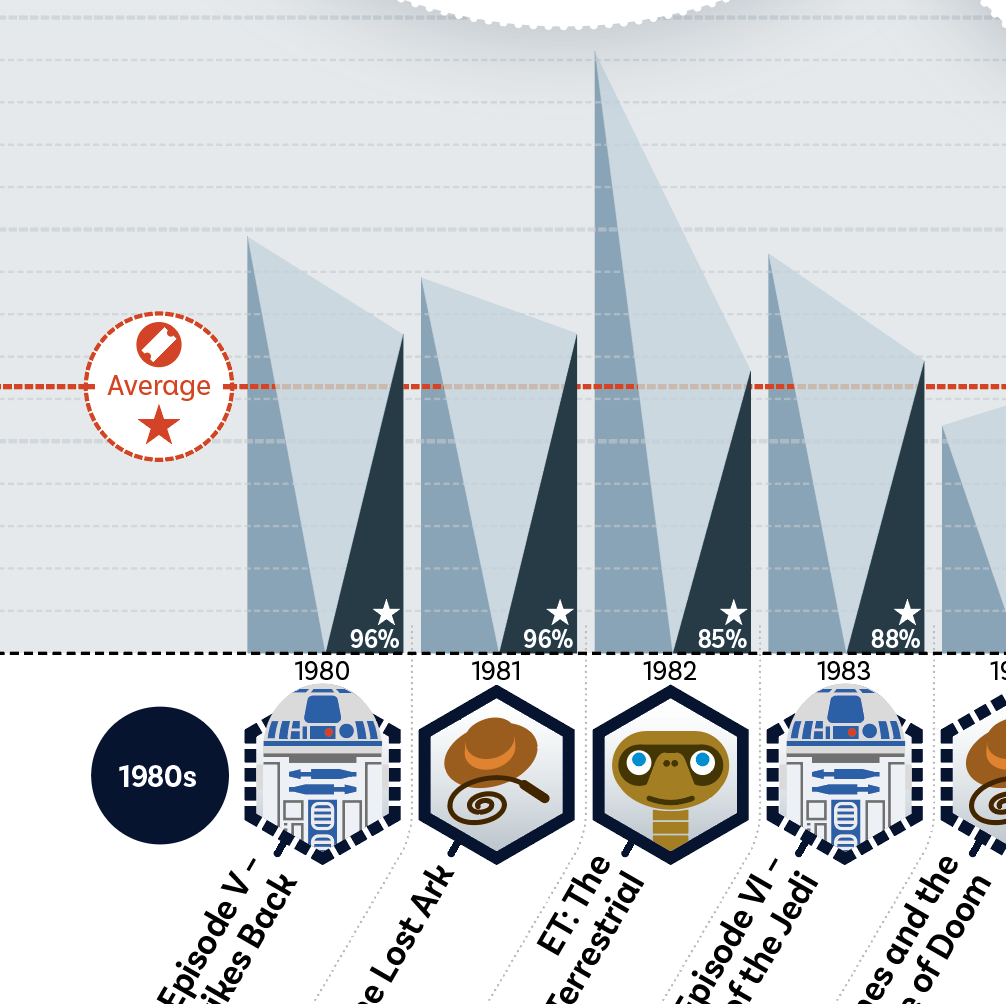
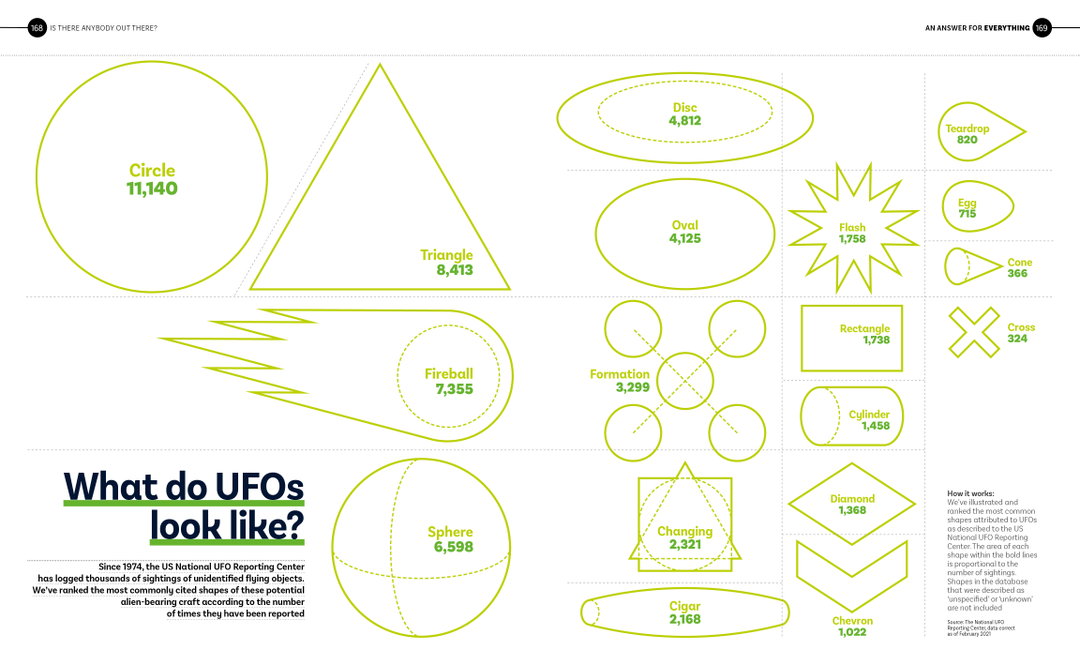
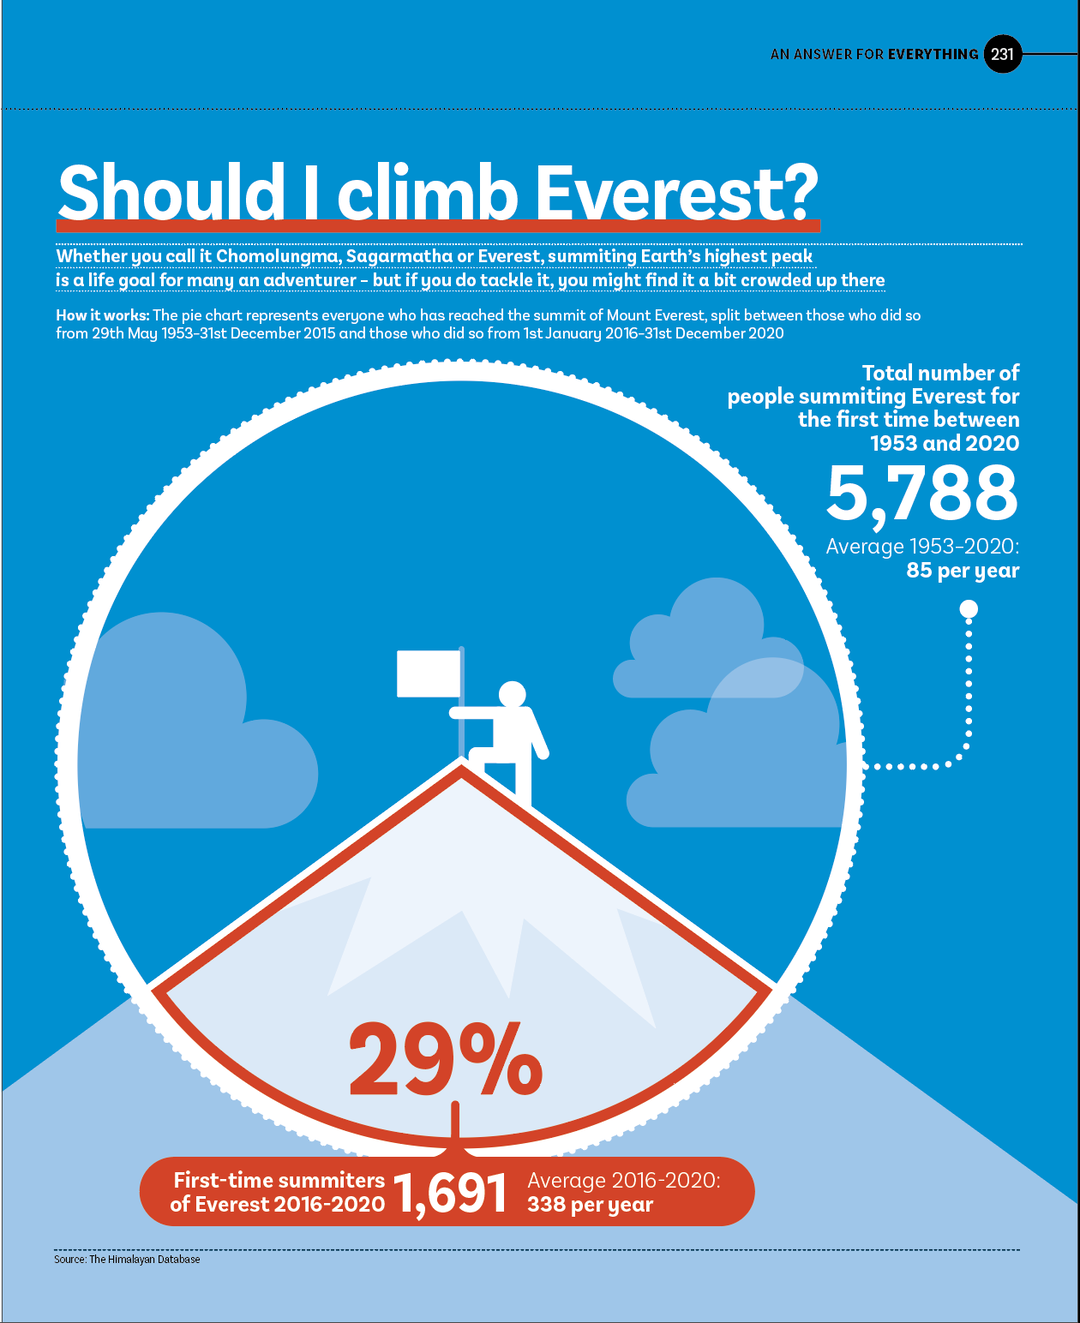
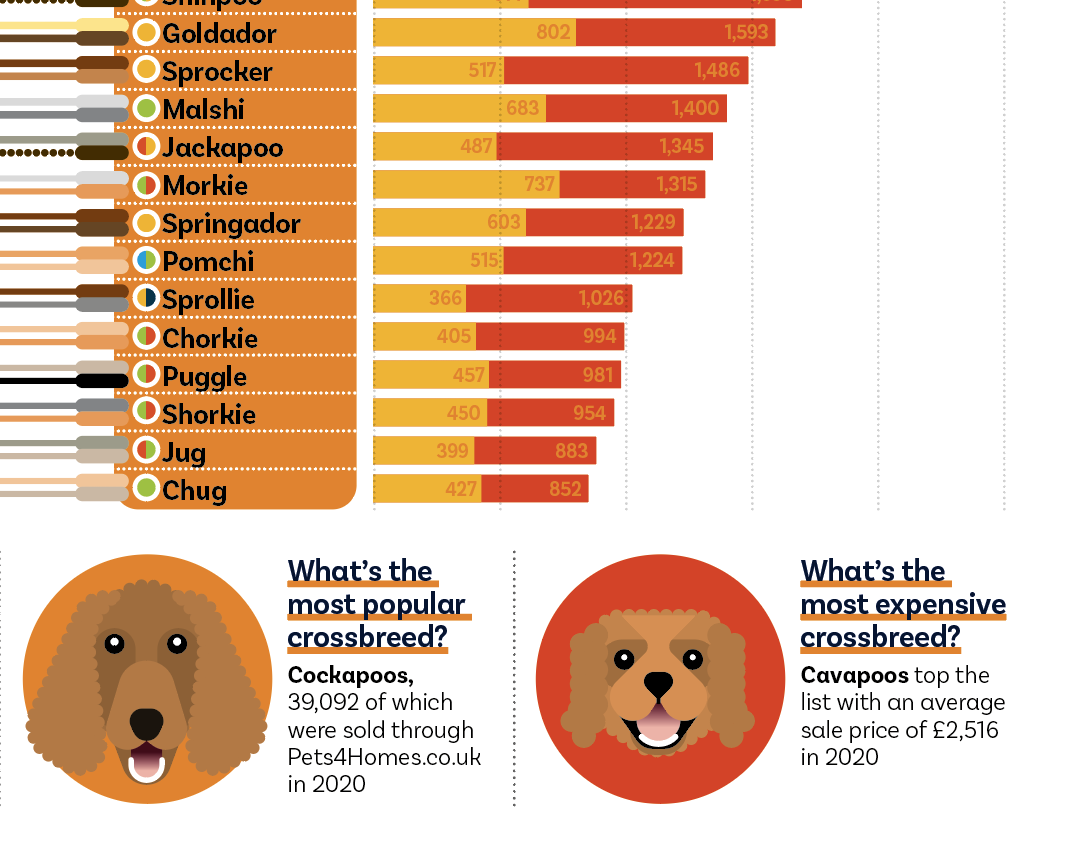
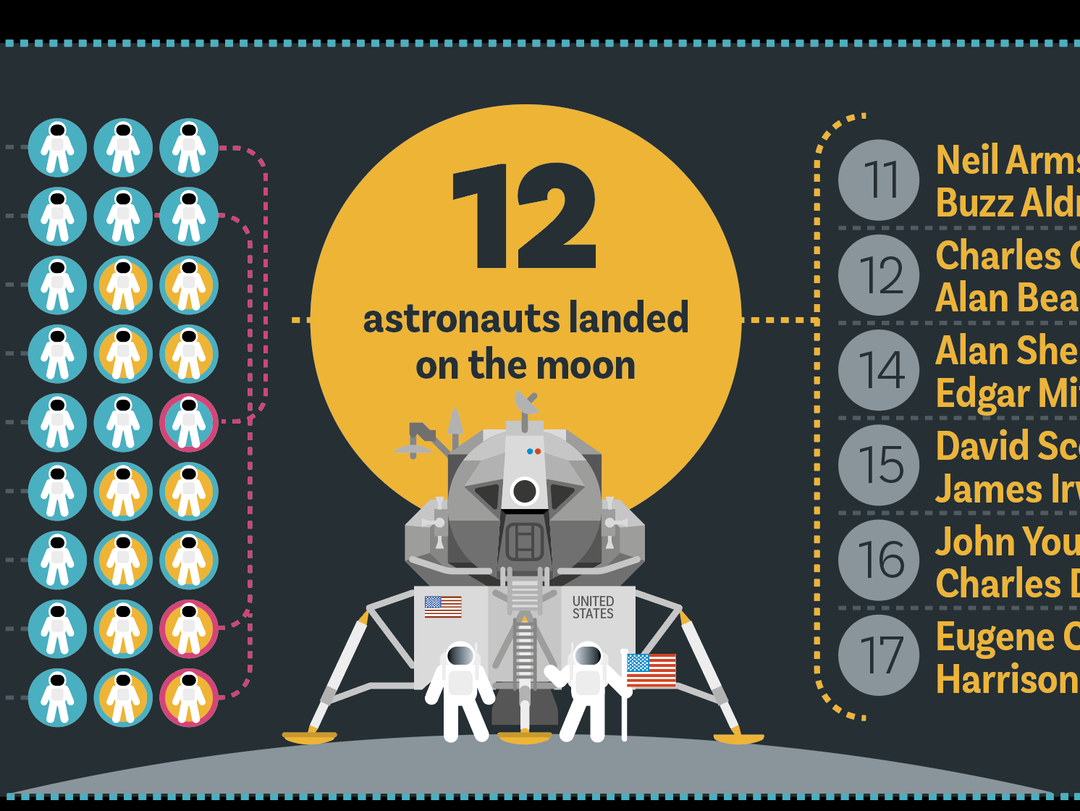
The book’s infographics, illustrated and designed by Tate, are clean and easy to read, meaning they’re intentionally accessible. But this doesn’t mean they lack personality and play. The attractive red hardback features smooth pages littered with minute details relating to each question: one could spend countless hours scanning the infographics featuring colourful illustrations alongside relevant information. Data just got a lot more fun.
The book is published by Bloomsbury and will become available for purchase on the 28 October, but you can pre-order it now.
GalleryCourtesy of The Slow Journalism Company.
Hero Header
Courtesy of The Slow Journalism Company
Share Article
Further Info
About the Author
—
Dalia is a freelance writer, producer and editor based in London. She’s currently the digital editor of Azeema, and the editor-in-chief of The Road to Nowhere Magazine. Previously, she was news writer at It’s Nice That, after graduating in English Literature from The University of Edinburgh.