




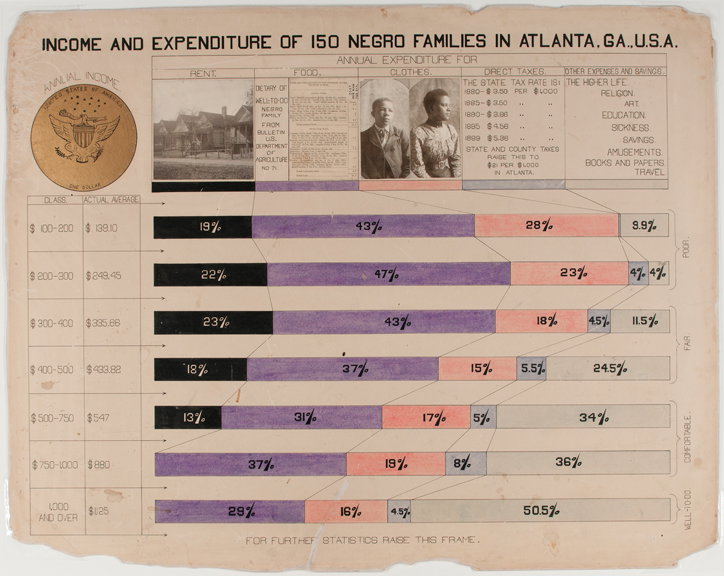
Back in 1900, activist W. E. B. Du Bois was using infographics to challenge white supremacy
You might know the name of African American activist and academic W. E. B. Du Bois for his seminal text The Souls of Black Folk, as the founder of the influential National Association for the Advancement of Colored People (NAACP) or even from a name-check in Beyoncé’s Homecoming Coachella film. But you probably won’t know him for his infographics.
A new exhibition, at London’s House of Illustration, co-curated by Paul Goodwin and Katie McCurrach, aims to change that. Focussing on the set of 63 infographics Du Bois presented at the 1900 Paris Exposition, it shows the pioneering graphs, charts and maps Du Bois developed with a team of African American students from his sociology laboratory at Atlanta University to radically challenge racism and the arguments behind white supremacy.
“The charts were radical in their purpose – Du Bois’ use of statistical data to refute racist claims was completely new,” says curator Katie McCurrach on Du Bois’ commission to create an exhibit for the Exposition Universelle in Paris, a huge world trade fair for the new century. “With his 63 charts, Du Bois was building up an argument against white supremacy, showing that African Americans were contributing to society – flourishing in education, purchasing land, starting businesses and publications – despite their status as people under slavery just forty years before, and despite continued discrimination and oppression.”
This, Katie explains, would have been particularly striking at the Exposition Universelle, which was essentially a celebration of French imperialism, and included displays of “living villages” where black people were shown in a derogative manner, as trophies of empire. “Du Bois’ display of scientific data was a direct challenge to this degrading presentation. He described it ‘an attempt to give, in as systematic and compact a form as possible, the history and present condition of a large group of human beings’,” says Katie. “Du Bois believed in the power of statistics to transform thinking, and these works contribute to illustration’s history as a discipline that can challenge ideas through visual communication.”
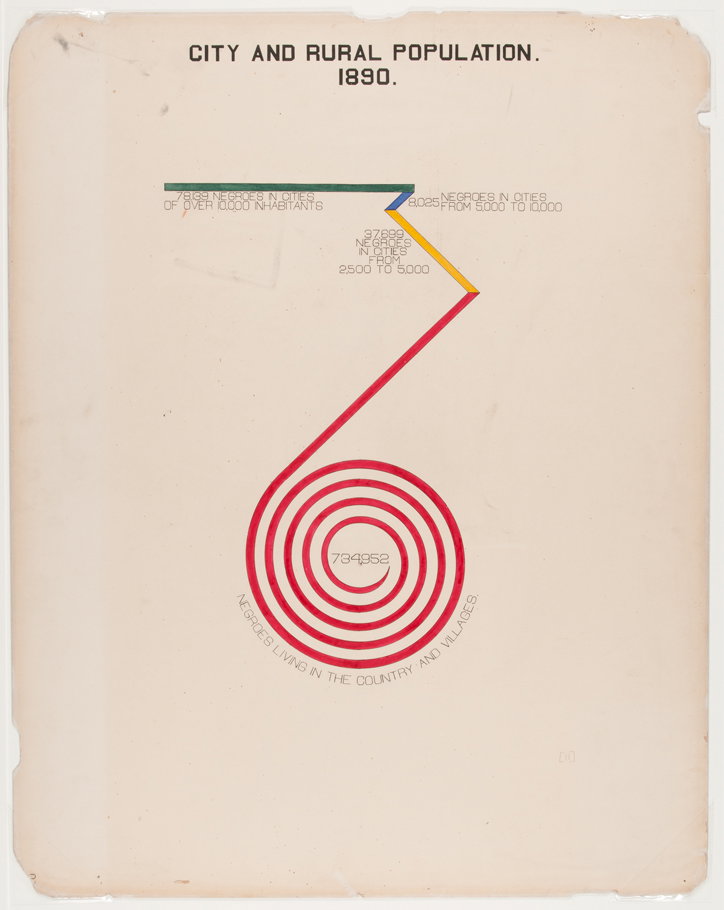
W. E. B. Du Bois: City and Rural Population, 1890
The creation of the charts was a collaborative process with a team of students and alumni from historically black Atlanta University. Together, they compiled data from records such as the United States census and research by Du Bois’ sociological laboratory, looking into subjects like the income and expenditure of black families, property ownership and the number of African American businessmen, teachers and black-owned media organisations.
Although data visualisation techniques like bar and pie charts date back to the 1700s and 1800s, Du Bois used many experimental chart forms, and played with visualisation techniques to make an impact. “He used a spiral shape several times in place of a straight bar, to emphasise figures so large that they couldn’t fit onto the page – this was not conventional practice,” says Katie. “The charts were also very modern in their use of colour. We still get a sense of their vibrancy over a century later.”
Sadly, the direct impact of the exhibit was limited, and despite Du Bois receiving a gold medal for his role as collaborator and compiler of materials for the exhibit, the white American press did not report on the exhibition. Not one to give up the fight, just three years later Du Bois published his masterpiece, The Souls of Black Folk. Katie says: “Perhaps it was frustration at the lack of impact seen from his sociological approach that led him to appeal in a different way, one which resonated with people across the world.”
Alongside the charts by Du Bois and his team, original artworks by The Guardian’s data editor Mona Chalabi feature in the exhibition, which will run until 1 March 2020. These new works will explore Du Bois’ clean lines, interesting use of shapes and bold primary colours, updating them for the 21st Century and showing the continued relevance of both Du Bois’ methods and, sadly, his fight against white supremacy.
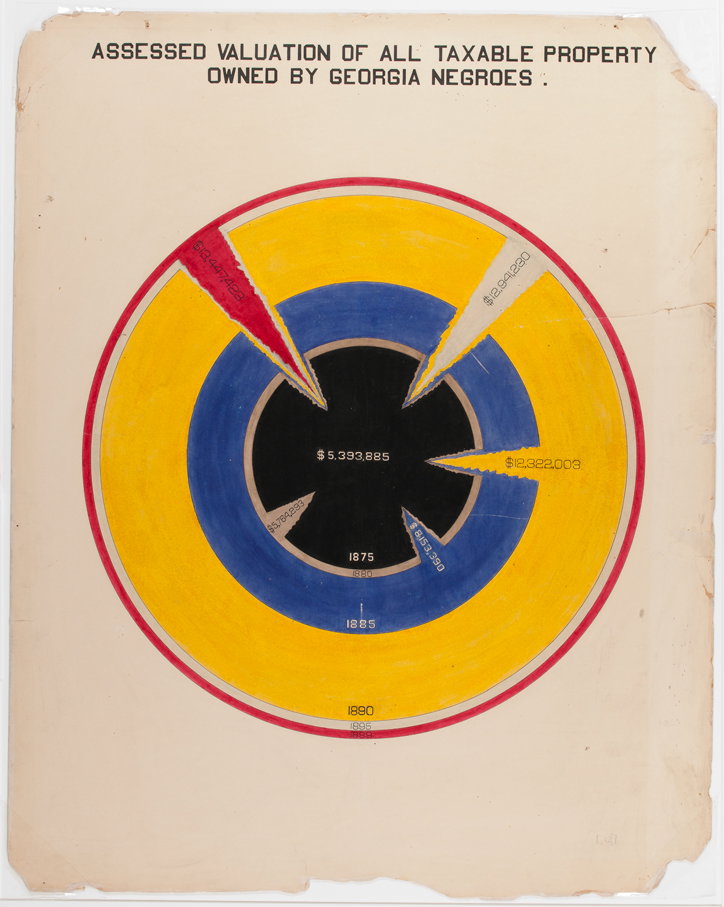
W. E. B. Du Bois: Assessed Valuation of All Taxable Property Owned by Georgia Negroes, courtesy of WEB Du Bois
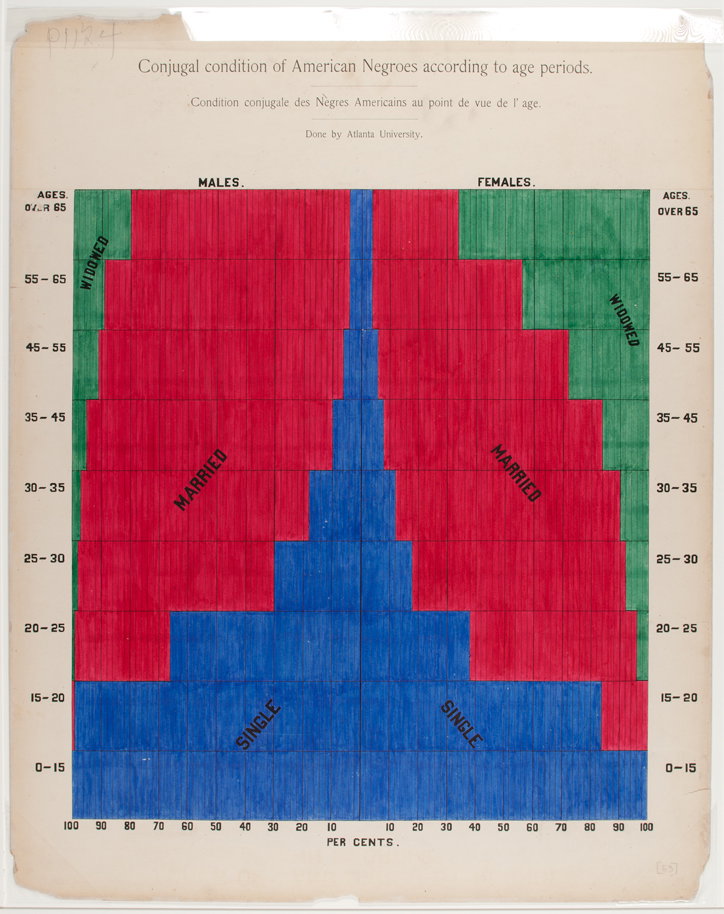
W. E. B. Du Bois: Conjugal Condition of American Negroes According to Age Periods, courtesy of WEB Du Bois
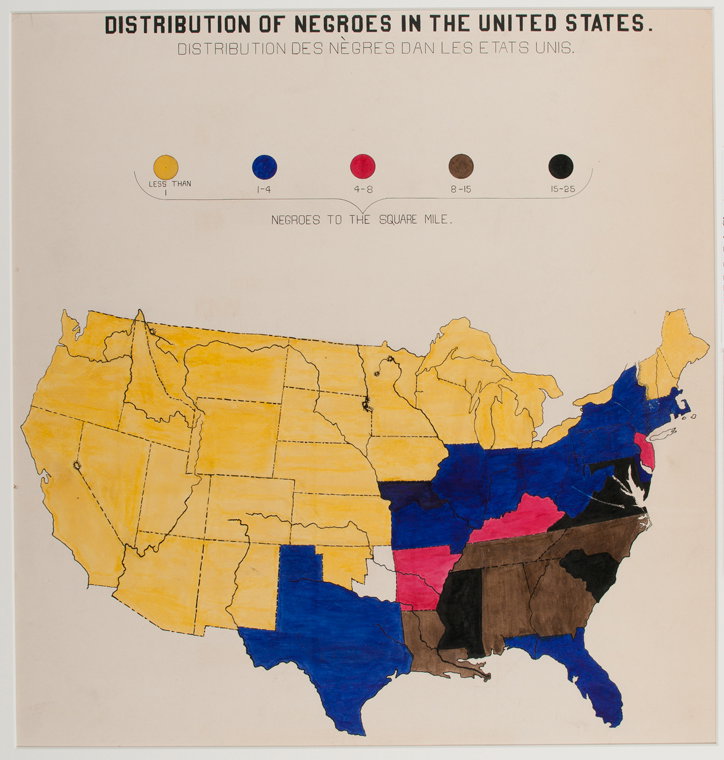
W. E. B. Du Bois: Distribution of Negroes in the United States, courtesy of WEB Du Bois
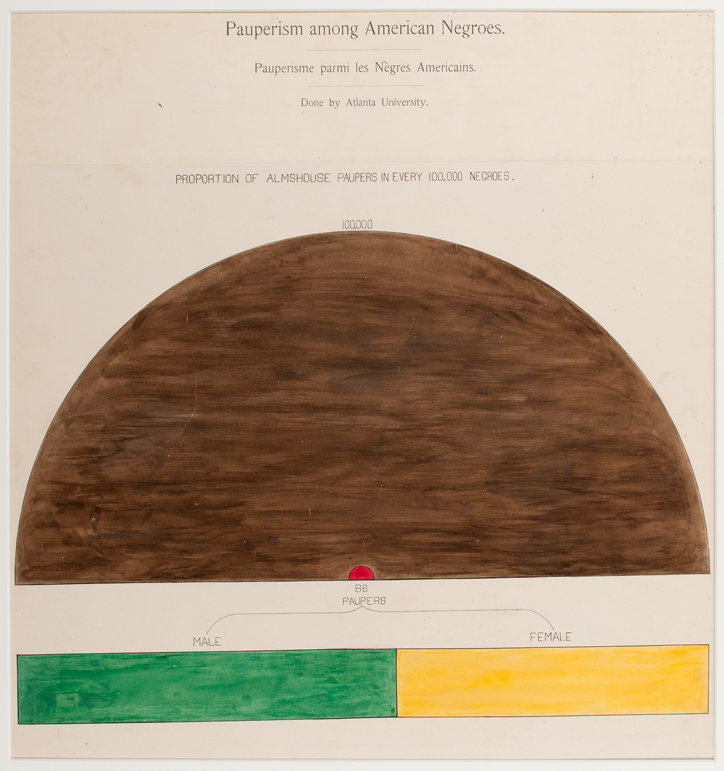
W. E. B. Du Bois: Pauperism Among American Negroes, courtesy of WEB Du Bois
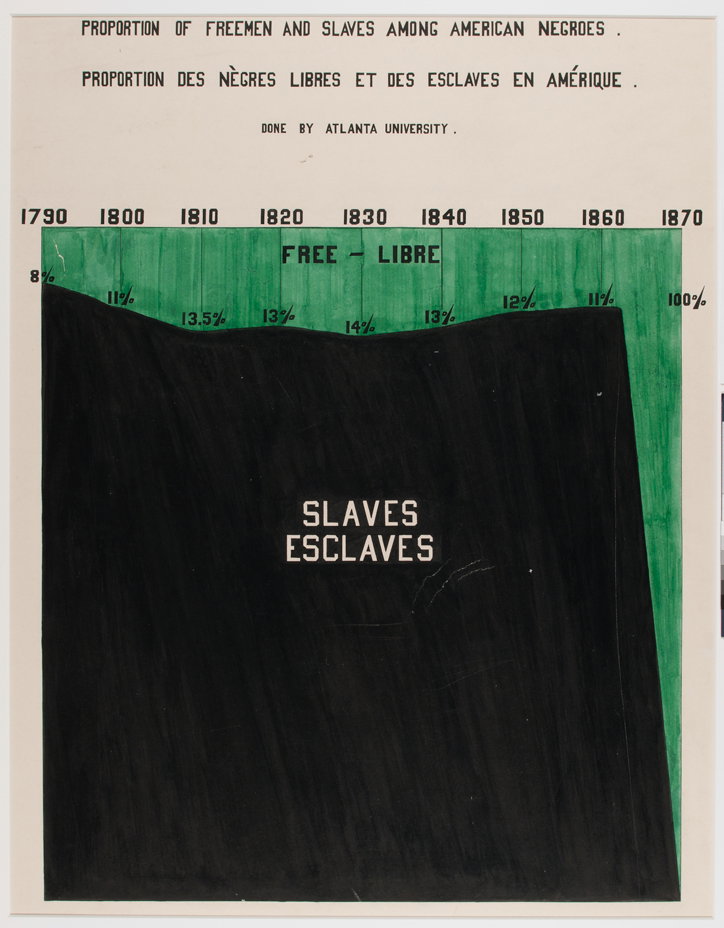
W. E. B. Du Bois: Proportion of Freemen and Slaves Among American Negroes, courtesy of WEB Du Bois
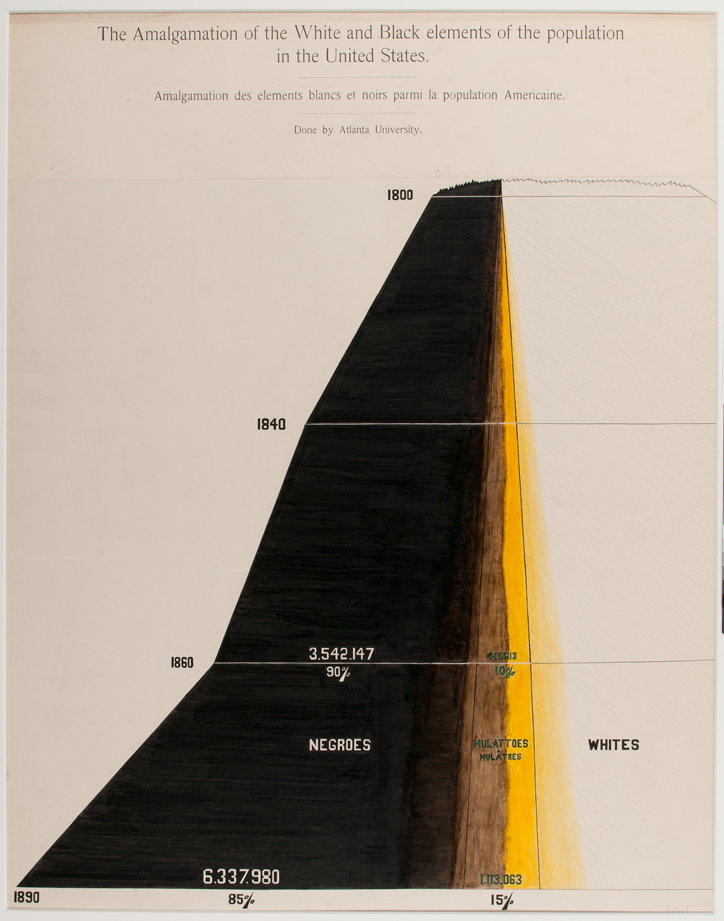
W. E. B. Du Bois: The Amalgamation of the White and Black Elements of the Population in the United-States, courtesy of WEB Du Bois
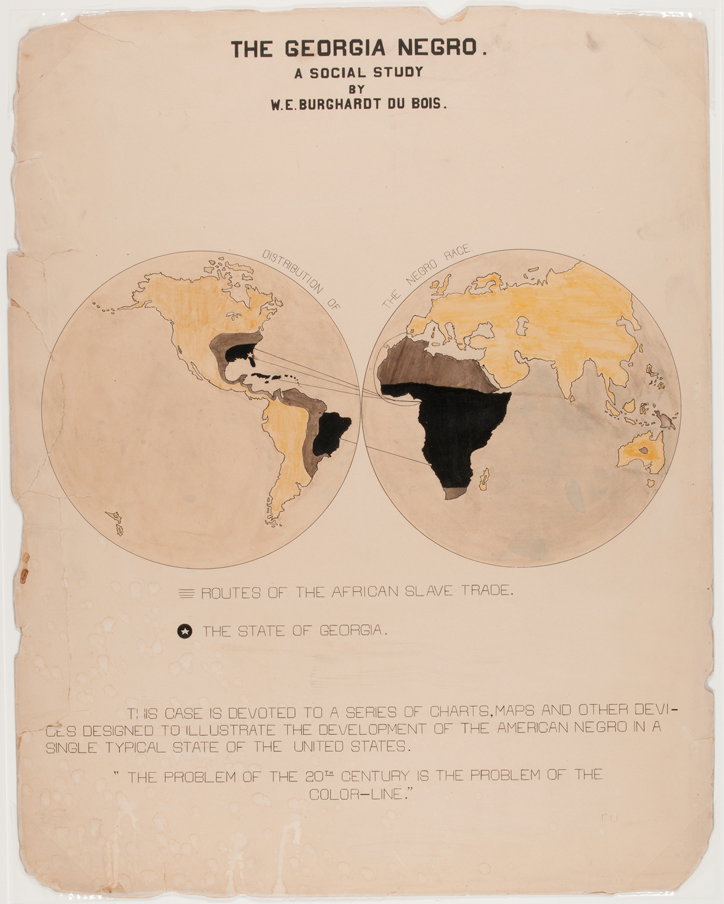
W. E. B. Du Bois: The Georgia Negro, courtesy of WEB Du Bois
Share Article
Further Info
About the Author
—
Laura is a London-based arts journalist who has been working for It’s Nice That on a freelance basis since 2016.